spotter.distributions#
Probability distributions and sampling utilities for stellar surface features.
This module provides functions to generate latitude distributions (e.g., butterfly distributions for active regions) and to sample latitudes uniformly or according to custom PDFs for spot placement on stars.
Functions#
|
Computes a butterfly-shaped probability density function (PDF) over latitudes. |
|
Sample latitudes uniformly on a sphere. |
Module Contents#
- spotter.distributions.buterfly_pdf(latitudes, latitude, scale)[source]#
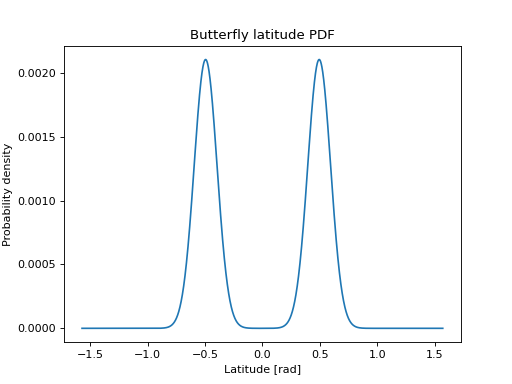
Computes a butterfly-shaped probability density function (PDF) over latitudes.
This function generates a symmetric PDF centered at latitude and -latitude using a normal distribution, then modulates it by the sine of the co-latitude to account for spherical geometry. The resulting distribution is normalized to sum to 1.
- Parameters:
latitudes (array_like) – Array of latitude values (in radians) at which to evaluate the PDF.
latitude (float) – Central latitude (in radians) for the butterfly distribution.
scale (float) – Standard deviation of the normal distributions.
- Returns:
lats_distribution – The normalized butterfly-shaped PDF evaluated at the input latitudes.
- Return type:
ndarray
Examples
Here is the butterfly distribution computed by this function
import matplotlib.pyplot as plt
import jax.numpy as jnp
from spotter.distributions import buterfly_pdf

lats = jnp.linspace(-jnp.pi / 2, jnp.pi / 2, 3000)
lats_dist = buterfly_pdf(lats, 0.5, 0.1)
plt.plot(lats, lats_dist)
plt.xlabel("Latitude [rad]")
plt.ylabel("Probability density")
plt.title("Butterfly latitude PDF")
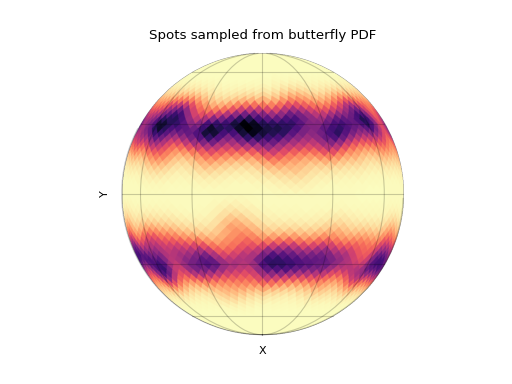
And here are spots whose positions are sampled using this distribution
import jax
import matplotlib.pyplot as plt
import jax.numpy as jnp
from spotter import Star, show
from spotter.distributions import buterfly_pdf

star = Star.from_sides(20)
n_spots = 1000
lats = jnp.linspace(-jnp.pi / 2, jnp.pi / 2, 3000)
lats_dist = buterfly_pdf(lats, 0.5, 0.1)
lat = jax.random.choice(jax.random.PRNGKey(9), lats, p=lats_dist, shape=(n_spots,))
lon = jax.random.uniform(
    jax.random.PRNGKey(7), minval=0, maxval=2 * jnp.pi, shape=(n_spots,)
)
spot_map = jnp.sum(jax.vmap(star.spot, in_axes=(0, 0, None))(lat, lon, 0.05), 0)
show(star.set(y=1 - spot_map))
plt.xlabel("X")
plt.ylabel("Y")
plt.title("Spots sampled from butterfly PDF")
- spotter.distributions.latitude_uniform_pdf(key, shape)[source]#
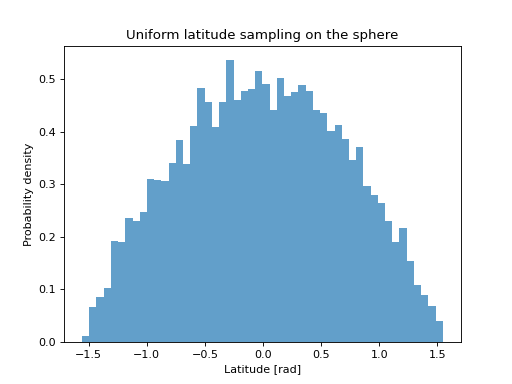
Sample latitudes uniformly on a sphere.
This function returns random latitude values (in radians) sampled uniformly over the surface of a sphere. The returned latitudes are distributed such that the probability per unit area is constant.
- Parameters:
key (jax.random.PRNGKey) – JAX random key.
shape (tuple of int) – Output shape of the samples.
- Returns:
latitudes – Array of latitude values in radians, shape given by shape.
- Return type:
jax.Array
Examples
Here is a histogram of latitudes sampled uniformly on the sphere:
import jax
import matplotlib.pyplot as plt
import jax.numpy as jnp
from spotter.distributions import latitude_uniform_pdf

key = jax.random.PRNGKey(0)
lats = latitude_uniform_pdf(key, (10000,))
plt.hist(lats, bins=50, density=True, alpha=0.7)
plt.xlabel("Latitude [rad]")
plt.ylabel("Probability density")
plt.title("Uniform latitude sampling on the sphere")