Precision & speed

Precision & speed#

Important

spotter is an approximate forward model. Light curves precision is expected to be no better than 1 ppm for most practical applications.
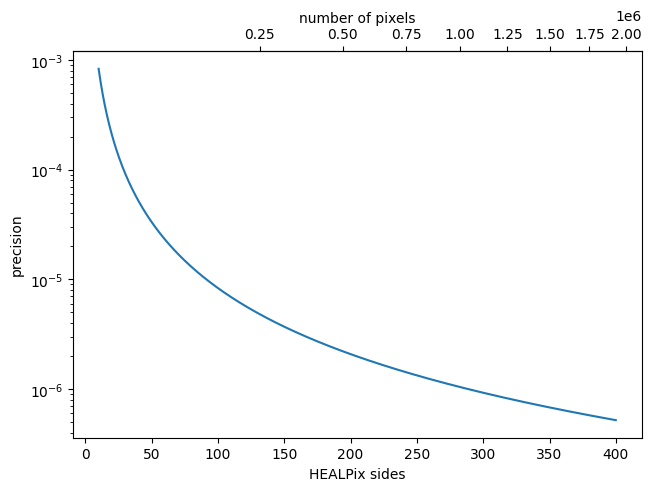
Overall precision#

The overall light curve precision of spotter depends on the resolution of the surface, which depends on the number of HEALPix sides used to describe it. A lower bound on the precision can be simply computed with

import healpy as hp

n_sides = 100
lower_precision = 1 / hp.nside2npix(n_sides)

print(f"{lower_precision:.2e}")
8.33e-06

Let’s plot the precision for different number of HEALPix sides

import numpy as np
import matplotlib.pyplot as plt

Ns = np.linspace(10, 400, 1000)
precision = 1 / np.vectorize(hp.nside2npix)(Ns)

fig, ax = plt.subplots(layout="constrained")
ax.plot(Ns, precision)
secax = ax.secondary_xaxis(
    "top", functions=(hp.nside2npix, lambda x: np.sqrt(x / 12.0))
)
secax.set_xlabel("number of pixels")

plt.yscale("log")
plt.ylabel("precision")
_ = plt.xlabel("HEALPix sides")
../../_images/c48c8d148f1f655af60f096bcf8c34eca7b85d33ace0e93fe5e5e65e83c62a6c.png

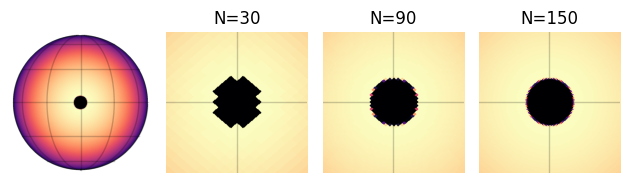
Transit light curves#

In order to evaluate transit light curves, spotter project the exoplanet disk onto the stellar surface pixels. This leads to high errors depending on the number of HEALPix sides used.

Let’s show the exoplanet pixelated disk for different number of sides.

import numpy as np
import matplotlib.pyplot as plt
from spotter import Star, light_curves, viz


star = Star.from_sides(100)
N = np.linspace(30, 150, 3).astype(int)
r = 0.1

plt.subplot(1, len(N) + 1, 1)
X = light_curves.transit_design_matrix(Star.from_sides(100), 0, 0, 1, r, 0)
viz.show(X[0])

for i, n in enumerate(N):
    plt.subplot(1, len(N) + 1, i + 2)
    X = light_curves.transit_design_matrix(Star.from_sides(int(n)), 0, 0, 1, r, 0)
    viz.show(X[0])
    plt.xlim(3 * np.array([-1, 1]) * r)
    plt.ylim(3 * np.array([-1, 1]) * r)
    plt.title(f"N={n}")

plt.tight_layout()
../../_images/9e65dd77b72567ff924d50a3060ed5876587a18f508cebe3865d141fde1a2a3d.png

Let now see the effect on a light curve precision

import jax
from spotter import light_curves

# impact parameter
b = np.linspace(-1.5, 1.5, 300)

for i, n in enumerate(N):
    star = star.from_sides(int(n), u=(0.1, 0.4))
    flux = jax.vmap(lambda b: light_curves.transit_light_curve(star, y=b, z=1, r=r))(b)
    plt.plot(b, flux, label=f"N={n}")

plt.legend()
plt.xlabel("impact parameter")
plt.ylabel("relative flux")
plt.tight_layout()
../../_images/a43104c21b161b76004d8de093c641abd759fc6eab51555312a5bf9b238defe4.png

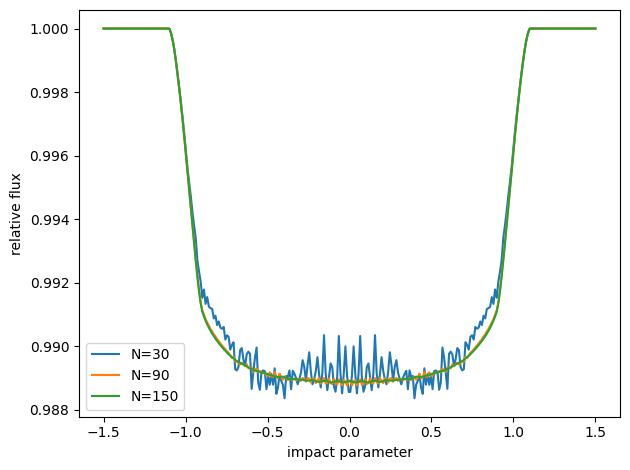
In this case too, the number computed in the last section provides a good lower bound on the light curve precision.
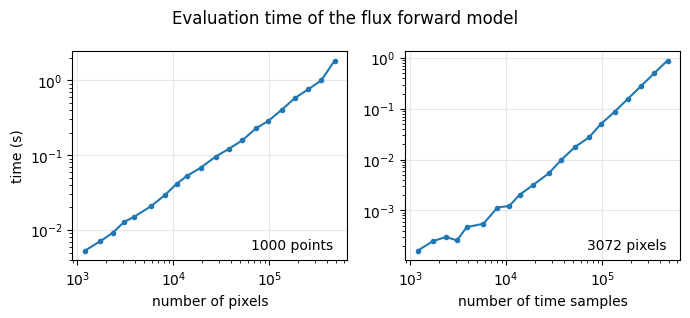
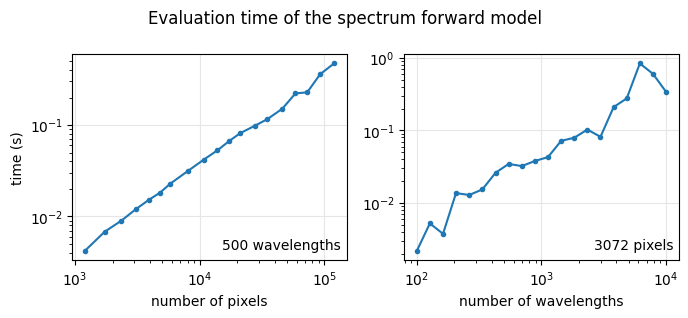
Speed#

For reference, below are some figures to benchmark the speed of spotter

Hide code cell source

import jax

device = "cpu"

jax.config.update("jax_platform_name", device)

import numpy as np
import healpy as hp

from time import time
import jax
from spotter.light_curves import light_curve
from spotter import Star
from tqdm.auto import tqdm
import matplotlib.pyplot as plt

sides = np.logspace(np.log10(10), np.log10(200), 20)
sides = np.round(sides).astype(int)
sides -= sides % 2
pixels = np.sort(np.unique([hp.nside2npix(N) for N in sides]))

n = 2

time_samples = np.linspace(0, 1, 1000)
times_for_1000_times = []

for N in tqdm(pixels, desc="benchmark for pixels"):
    y = np.random.rand(N)
    star = Star(y, u=(0.5, 0.2), inc=1.2, period=1.0)
    lc = jax.jit(light_curve)
    jax.block_until_ready(lc(star, time_samples)[0])
    _ = []
    for i in range(n):
        tic = time()
        jax.block_until_ready(lc(star, time_samples)[0])
        _.append(time() - tic)
    times_for_1000_times.append(np.median(_))


times_samples = np.sort(np.unique(np.round(np.logspace(0, 5, 20)).astype(int)))
times_for_some_pixels = []
y = np.random.rand(hp.nside2npix(2**4))
star = Star(y, u=(0.5, 0.2), inc=1.2, period=1.0)
lc = jax.jit(light_curve)

for N in tqdm(times_samples, desc="benchmark for n time samples"):
    time_samples = np.linspace(0, 1, N)
    jax.block_until_ready(lc(star, time_samples)[0])
    _ = []
    for i in range(n):
        tic = time()
        jax.block_until_ready(lc(star, time_samples)[0])
        _.append(time() - tic)
    times_for_some_pixels.append(np.median(_))

fig, axes = plt.subplots(1, 2, figsize=(7, 3.2))
axes[0].plot(pixels, times_for_1000_times, ".-", label=device)
axes[0].set_xscale("log")
axes[0].set_yscale("log")
axes[0].set_xlabel("number of pixels")
axes[0].set_ylabel("time (s)")
axes[0].grid(color="0.9")
axes[0].text(0.95, 0.05, "1000 points", ha="right", transform=axes[0].transAxes)


axes[1].plot(pixels, times_for_some_pixels, ".-", label=device)
axes[1].set_xscale("log")
axes[1].set_yscale("log")
axes[1].set_xlabel("number of time samples")
axes[1].grid(color="0.9")
axes[1].text(0.95, 0.05, f"{len(y)} pixels", ha="right", transform=axes[1].transAxes)

plt.suptitle("Evaluation time of the flux forward model")
plt.tight_layout()
../../_images/a59ecadd2dcc1ddb0a4b054c9518ae7b991f691539251a32615f17821eb563c6.png

Hide code cell source

import jax.numpy as jnp
from spotter.doppler import spectrum

base_star = Star.from_sides(2**4, period=0.02, u=(0.2, 0.2), inc=1.4)

pixels = hp.nside2npix(2**4)

times_for_wv = []
n_wls = np.logspace(2, 4, 20).astype(int)
f = jax.jit(spectrum)

for n_wl in tqdm(n_wls, desc="benchmark for wavelengths"):
    wv = jnp.linspace(400, 410, n_wl) * 1e-9
    spectra = np.random.rand(n_wl, pixels)
    star = base_star.set(y=spectra, wv=wv)
    jax.block_until_ready(f(star, 0.1))
    _ = []
    for i in range(n):
        tic = time()
        jax.block_until_ready(f(star, 0.1))
        _.append(time() - tic)
    times_for_wv.append(np.median(_))

times_for_pix = []
n_wl = 500
wv = jnp.linspace(400, 410, n_wl) * 1e-9
sides = np.logspace(1, 2.0, 20)
sides = np.round(sides).astype(int)
sides -= sides % 2
pixels = np.sort(np.unique([hp.nside2npix(N) for N in sides]))
f = jax.jit(spectrum)

for N in tqdm(pixels, desc="benchmark for pixels"):
    spectra = np.random.rand(n_wl, N)
    star = base_star.set(y=spectra, wv=wv)
    jax.block_until_ready(f(star, 0.1))
    _ = []
    for i in range(n):
        tic = time()
        jax.block_until_ready(f(star, 0.1))
        _.append(time() - tic)
    times_for_pix.append(np.median(_))

import matplotlib.pyplot as plt

fig, axes = plt.subplots(1, 2, figsize=(7, 3.2))
axes[1].plot(n_wls, times_for_wv, ".-", label=device)
axes[1].set_xscale("log")
axes[1].set_yscale("log")
axes[1].set_xlabel("number of wavelengths")
axes[1].grid(color="0.9")
axes[0].text(0.98, 0.05, "500 wavelengths", ha="right", transform=axes[0].transAxes)


axes[0].plot(pixels, times_for_pix, ".-", label=device)
axes[0].set_xscale("log")
axes[0].set_yscale("log")
axes[0].set_xlabel("number of pixels")
axes[0].grid(color="0.9")
axes[0].set_ylabel("time (s)")
axes[1].text(
    0.98, 0.05, f"{base_star.size} pixels", ha="right", transform=axes[1].transAxes
)

plt.suptitle("Evaluation time of the spectrum forward model")
plt.tight_layout()
../../_images/cd498a620e901e057e5ed42c5f7e15116fc0902983442a57af5818fc66058420.png