Spot occultation#
In this tutorial we demonstrate how to use spotter to model the occultation of a non-uniform surface - here with a spot - by a transited exoplanet.
Note
This tutorial requires jaxoplanet
import jax
jax.config.update("jax_enable_x64", True)
from spotter import Star, show, core
from spotter.light_curves import transit_light_curve
from jaxoplanet.orbits.keplerian import Central, Body, System
from jaxoplanet.orbits import TransitOrbit
import numpy as np
r = 0.2
body = Body(time_transit=0.0, period=1.0, radius=r, impact_param=0.0)
system = System().add_body(body)
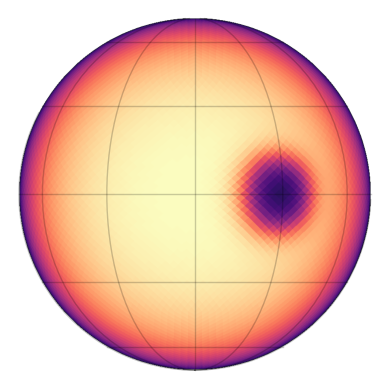
star = Star.from_sides(30, u=(0.1, 0.5))
star = star.set(y=1 - 0.5 * core.spot(star.sides, 0.0, 0.5, 0.2, 20))
def planet_coords(system, time):
xos, yos, zos = system.relative_position(time)
x = xos[0] / system.central.radius
y = yos[0] / system.central.radius
z = zos[0] / system.central.radius
return x, y, z
def flux_model(star, system, time):
coords = planet_coords(system, time)
flux = jax.vmap(
lambda coords, time: transit_light_curve(star, *coords, r=r, time=time)
)(coords, time).T[0]
return flux
show(star)
import numpy as np
import matplotlib.pyplot as plt
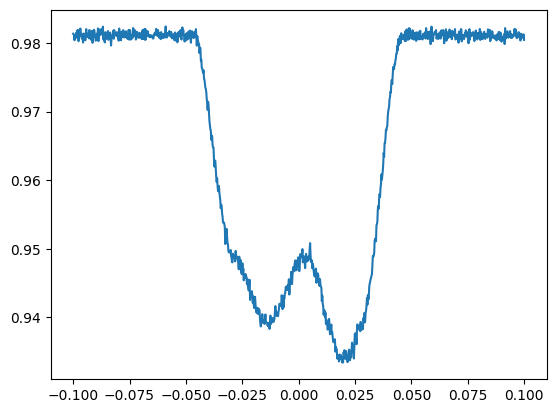
time = np.linspace(-0.1, 0.1, 1000)
flux = flux_model(star, system, time) + np.random.randn(1000) * 0.0005
plt.plot(time, flux)
[<matplotlib.lines.Line2D at 0x7640c1cf9ba0>]
import tinygp
from spotter.kernels import GreatCircleDistance

kernel = 0.1 * tinygp.kernels.Matern52(0.2, distance=GreatCircleDistance())
gp = tinygp.GaussianProcess(kernel, core.vec(star.sides))
y = gp.sample(jax.random.PRNGKey(2), shape=(1,))[0]
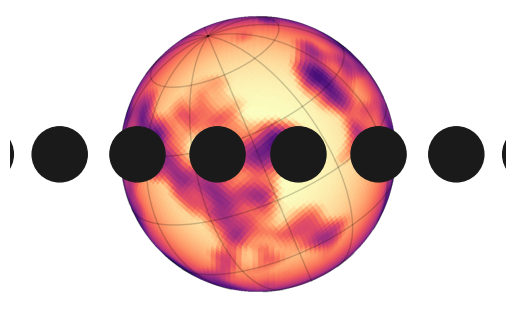
star = star.set(y=1.0 - 0.7 * y.clip(0.0, 1.0), obl=0.4, inc=1.2)
show(star)
for t in np.linspace(time.min(), time.max(), 10):
x, y, _ = planet_coords(system, t)
circle = plt.Circle((x, y), r, color="0.1", zorder=10)
plt.gca().add_artist(circle)
plt.xlim(-1.8, 1.8)
(-1.8, 1.8)
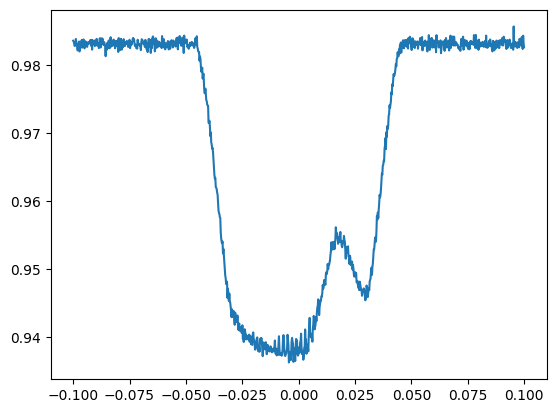
import numpy as np
import matplotlib.pyplot as plt

time = np.linspace(-0.1, 0.1, 1000)

flux = flux_model(star, system, time) + np.random.randn(len(time)) * 0.0005
plt.plot(time, flux)
[<matplotlib.lines.Line2D at 0x7640c0605600>]