
Introduction#
spotter is a package to compute forward models of fluxes and spectra time-series of non-uniform stars.
Its main advantage over other frameworks is its capability to model small scale features thanks to the surface being subdivided into equal-area pixels. In order to do that, spotter exploits the HEALPix subdivision scheme (through the python package healpy).
Here is an introduction on how to define a stellar surface with spotter.
Star object#
We can define a Star object that will contain the map of the star plus some of its parameters such as limb darkening
import matplotlib.pyplot as plt
from spotter import Star, show

star = Star.from_sides(16, u=(0.5, 0.2))

plt.figure(figsize=(3, 3))
show(star)
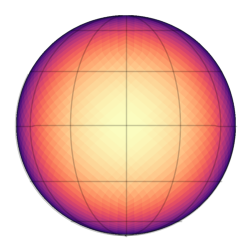
As you can see, we defined the map using a number of sides, not pixels, which is how maps are defined in the HEALPix grid. Check out the HEALPix documentation for more information.
Map pixels values#
The pixels value of a star can be directly accessed with
star.y
Array([[1., 1., 1., ..., 1., 1., 1.]], dtype=float32)
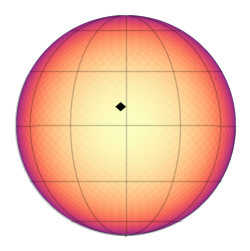
The shape of this array is (wavelength, pixels), with the first dimension being for the wavelength axis. Using JAX, here is how we would set a specific pixel i to a certain value.
i = 1248

new_y = star.y.at[0, i].set(0.0)
star = star.set(y=new_y)

plt.figure(figsize=(3, 3))
show(star)
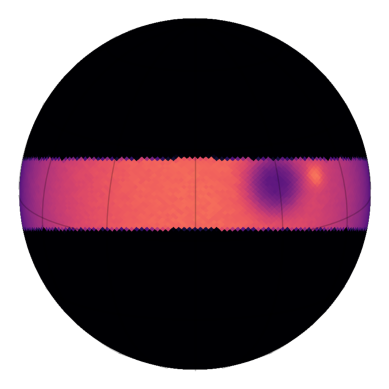
Spots#
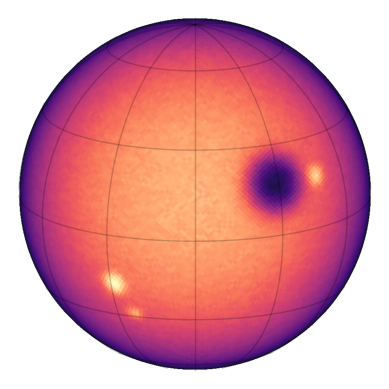
As an example let’s define a map with some spots on it. We will first define a surface with more pixels, a non-zero inclination and a rotation period
import numpy as np

star = star.from_sides(50, inc=1.3, u=(0.5, 0.2), period=1.0)
Let’s now add some noise, a spot and faculae
star = star.set(y=1 + 0.05 * np.random.rand(star.size))  # noise
star = star.set(y=star.y - 0.6 * star.spot(0.3, 0.5, 0.15, 25))  # spot

faculae = np.sum(
    [
        star.spot(0.3, 0.8, 0.05, 60) * 0.3 * star.y,
        star.spot(-0.3, -0.5, 0.06, 60) * 0.35 * star.y,
        star.spot(-0.5, -0.4, 0.03, 60) * 0.3 * star.y,
    ],
    0,
)

star = star.set(y=star.y + faculae)

show(star)
Light curves#
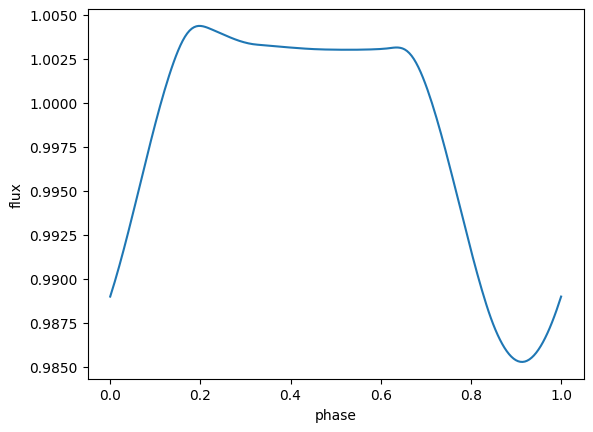
Once a surface defined, spotter can be used to compute its light curve.
import jax
from spotter.light_curves import light_curve

time = np.linspace(0, star.period, 200)

plt.plot(time, light_curve(star, time)[0])
plt.xlabel("phase")
_ = plt.ylabel("flux")
Note
All functions in spotter are carefully implemented with JAX, meaning that they can be vectorized and run on GPUs. For example this could be useful to evaluate the flux of a very large number of maps.
spotter can also be used to compute the light curve of a transited star
from spotter.star import transited_star
from spotter.light_curves import transit_light_curve

# impact parameter
b = np.linspace(-2, 2, 100)

flux = jax.vmap(lambda b: transit_light_curve(star, y=b, r=0.3)[0])(b)

plt.figure(figsize=(7, 3))
plt.subplot(121)
plt.plot(b, flux)
plt.xlabel("impact parameter")
plt.ylabel("flux")

plt.subplot(122)
show(transited_star(star, y=0.3, r=0.2))
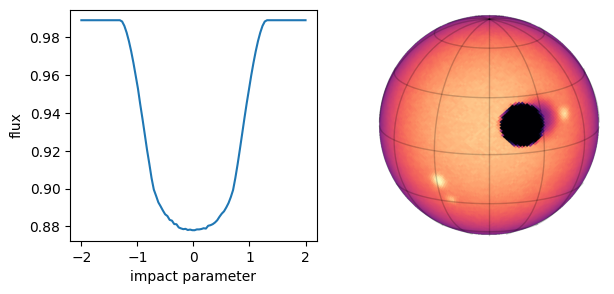
Important
As you can see the transit light curve model contains errors due to the pixelization of the star. This is why spotter is considered an approximate model only. Check out this page for more details about spotter’s precision.
JAX and spotter core functions#
Using spotter core functions directly, other observables can be computed as well. Here are some examples
Ensemble of rotation light curves#
from spotter import distributions
from spotter.core import amplitude, spot

# number of healpix sides
N = 16

# generate maps with a single random spot
n_spots = 500
key = jax.random.PRNGKey(0)
lats = distributions.latitude_uniform_pdf(key, (n_spots,))
lons = np.random.uniform(0, 2 * np.pi, n_spots)
radii = np.random.uniform(0.01, 0.9, n_spots)
contrast = np.random.uniform(0.01, 0.9, n_spots)
ys = 1 - jax.vmap(jax.jit(spot, static_argnums=(0,)), in_axes=(None, 0, 0, 0))(
    N, lats, lons, radii
)

amplitude = jax.jit(amplitude(N, u=star.u[0]))
values = amplitude(ys)
---------------------------------------------------------------------------
ValueError                                Traceback (most recent call last)
Cell In[8], line 18
     13 contrast = np.random.uniform(0.01, 0.9, n_spots)
     14 ys = 1 - jax.vmap(jax.jit(spot, static_argnums=(0,)), in_axes=(None, 0, 0, 0))(
     15     N, lats, lons, radii
     16 )
---> 18 amplitude = jax.jit(amplitude(N, u=star.u[0]))
     19 values = amplitude(ys)

File ~/checkouts/readthedocs.org/user_builds/spotter/envs/stable/lib/python3.10/site-packages/spotter/core.py:401, in amplitude(N_or_y, inc, u, undersampling)
    398 hp_resolution = resolution * undersampling
    399 phases = jnp.arange(0, 2 * jnp.pi, hp_resolution)
--> 401 mask, projected_area, limb_darkening = jax.jit(
    402     jax.vmap(jax.jit(mask_projected_limb), in_axes=(None, 0, None, None))
    403 )(N, phases, inc, u)
    405 geometry = mask * projected_area
    406 norm = (geometry * limb_darkening).sum(1)

    [... skipping hidden 35 frame]

File ~/checkouts/readthedocs.org/user_builds/spotter/envs/stable/lib/python3.10/site-packages/spotter/core.py:134, in mask_projected_limb(N_or_y, phase, inc, u, obl)
    108 def mask_projected_limb(N_or_y, phase=None, inc=None, u=None, obl=None):
    109     """
    110     Compute mask, projected area, and limb darkening for visible pixels.
    111
   (...)
    132         Limb darkening factor for each pixel.
    133     """
--> 134     N, _ = _N_or_Y_to_N_n(N_or_y)
    135     X = vec(N)
    136     d = distance(X, equator_coords(phase, inc, obl))

File ~/checkouts/readthedocs.org/user_builds/spotter/envs/stable/lib/python3.10/site-packages/spotter/core.py:170, in _N_or_Y_to_N_n(N_or_y)
    168     N = N_or_y
    169 else:
--> 170     N = hp.npix2nside(N_or_y.size)
    171     n = N_or_y.size
    172 return N, n

File ~/checkouts/readthedocs.org/user_builds/spotter/envs/stable/lib/python3.10/site-packages/healpy/pixelfunc.py:1121, in npix2nside(npix)
   1089 """Give the nside parameter for the given number of pixels.
   1090
   1091 Parameters
   (...)
   1118 ValueError: Wrong pixel number (it is not 12*nside**2)
   1119 """
   1120 if not isnpixok(npix):
-> 1121     raise ValueError("Wrong pixel number (it is not 12*nside**2)")
   1122 return int(np.sqrt(npix / 12.0))

ValueError: Wrong pixel number (it is not 12*nside**2)
Here we evaluated the amplitude of the rotational light curves of 500 maps, each containing a single random spot. Let’s estimate the processing time of this computation
%timeit amplitude(ys)
693 μs ± 12.5 μs per loop (mean ± std. dev. of 7 runs, 1,000 loops each)
i.e. about tens of \(\mu s\) per unique map!
Note
Notice here how we didn’t use the Star object at all. Sometimes, especially when dealing with a large number of stars, spotter’s objects are not as optimal as working directly with the stellar maps, especially when using JAX transforms.
Stellar contamination estimates#
Other features of spotter are useful to compute the spot coverage, either of the map itself
# trivial
spotted = star.y < 1.0
coverage = np.mean(spotted)

print(f"coverage: {coverage * 100:.2f}%")
coverage: 1.98%
or within a specific transit chord
from spotter.core import mask_projected_limb, transit_chord, vec

transit = transit_chord(star.N, 0.0, 0.2, star.inc)

mask, area, _ = mask_projected_limb(vec(star.N), u=star.u[0], inc=star.inc)

spotted = (star.y[0] < 1.0) * mask
transited = transit * mask > 0.0

# let's show the chord
show(star * transited, vmin=0.0, vmax=1.5)

# covering fraction in the chord
chord_coverage = (spotted * transited * area).sum() / (transited * area).sum()
print(f"chord coverage: {chord_coverage * 100:.2f}%")
chord coverage: 20.59%
which is useful to compute transmission spectroscopy stellar contamination effects.